Applied behavior analysis stands on one habit: decisions follow data. Which makes ABA data collection — the unglamorous question of how exactly is this behavior being recorded? — the most consequential decision in a program. This is a field guide to the main methods, the rule for choosing between them, and the two checks that decide whether the numbers deserve to drive anything.
Figure — Which measure fits which behavior
- The behavior looks like The adult presents something; the child responds once. Matching, receptive labels, imitation
- Measure Accuracy per trial Correct / incorrect / prompted, with the prompt level attached. How it lies: A session percentage hides that most correct responses were prompted, or that every error sat on one target.
- The behavior looks like The child emits it freely; you can count it. Requests, vocalizations, a target sound
- Measure Frequency → rate Occurrences divided by a recorded observation window. How it lies: A count without its window cannot be read at all, and a window too short to matter still produces a per-minute number.
- The behavior looks like It lasts, and the length is the point. Engagement, tantrums, time on task
- Measure Duration Total duration and duration per occurrence, reported separately. How it lies: One twenty-minute episode and twenty one-minute episodes share a total and need different programs.
- The behavior looks like The response comes, but you are watching the wait. Fluency goals, emerging prompt dependency
- Measure Latency Instruction to response, summarized by the median. How it lies: A fast error is still an error — speed is evidence alongside accuracy, never instead of it.
Whatever the row, two questions matter for whether its numbers can be trusted: would a second observer have recorded the same thing, and did the session run as the program prescribes?
The methods at a glance
| Method | What it measures | When to use it |
|---|---|---|
| Trial-by-trial data | The response to each teacher-presented trial: correct, incorrect or prompted, and at what prompt level | Discrete tasks such as matching, receptive labels or imitation |
| Percent correct vs percent independent | How many trials were answered correctly, and how many of those needed no prompt | Whenever prompts are used, so that prompted responses do not pass as independent skill |
| Frequency and rate | How many times a behavior happens, and how often per unit of time | Behavior the child produces freely and that can be counted, such as requests or vocalizations |
| Duration | How long the behavior lasts, in total and per episode | Behavior whose length matters more than its count, such as engagement or tantrums |
| Latency | The time from a defined cue to the start of the response | When speed or readiness to respond is the goal |
| PLA-check | The share of a group engaged in an activity at planned moments | Group settings, to see how many people are on task |
| Permanent product | A lasting result that the behavior leaves behind | When the result proves the behavior, such as a finished puzzle or a written word |
Trial-by-trial data
For discrete, teacher-presented tasks — matching, receptive labels, imitation — the natural record is one scored response per trial: correct, incorrect, prompted, at what prompt level. From it come percent correct, prompted-versus-independent breakdowns, and error patterns.
Its failure mode is aggregation: a session’s “85%” can hide that most correct responses were prompted, or that all the errors sat on one target. Keep the prompt level attached to every response, and read per-target numbers before session-wide ones. Records of this kind are the working unit of discrete trial training, where every trial has a defined instruction, response and consequence.
Percent correct vs percent independent
Percent correct counts every correct response, prompted or not, out of all trials. Percent independent counts only the correct responses given with no prompt. For example, in 10 trials a learner answers 9 correctly, but 6 of those 9 came after a gestural prompt. Percent correct is 9 ÷ 10 = 90%. Percent independent is 3 ÷ 10 = 30%. Both numbers are true; only the second says how much the learner can do alone. Report them side by side, and keep the prompt level on each response so the split can always be recomputed.
Rate vs frequency
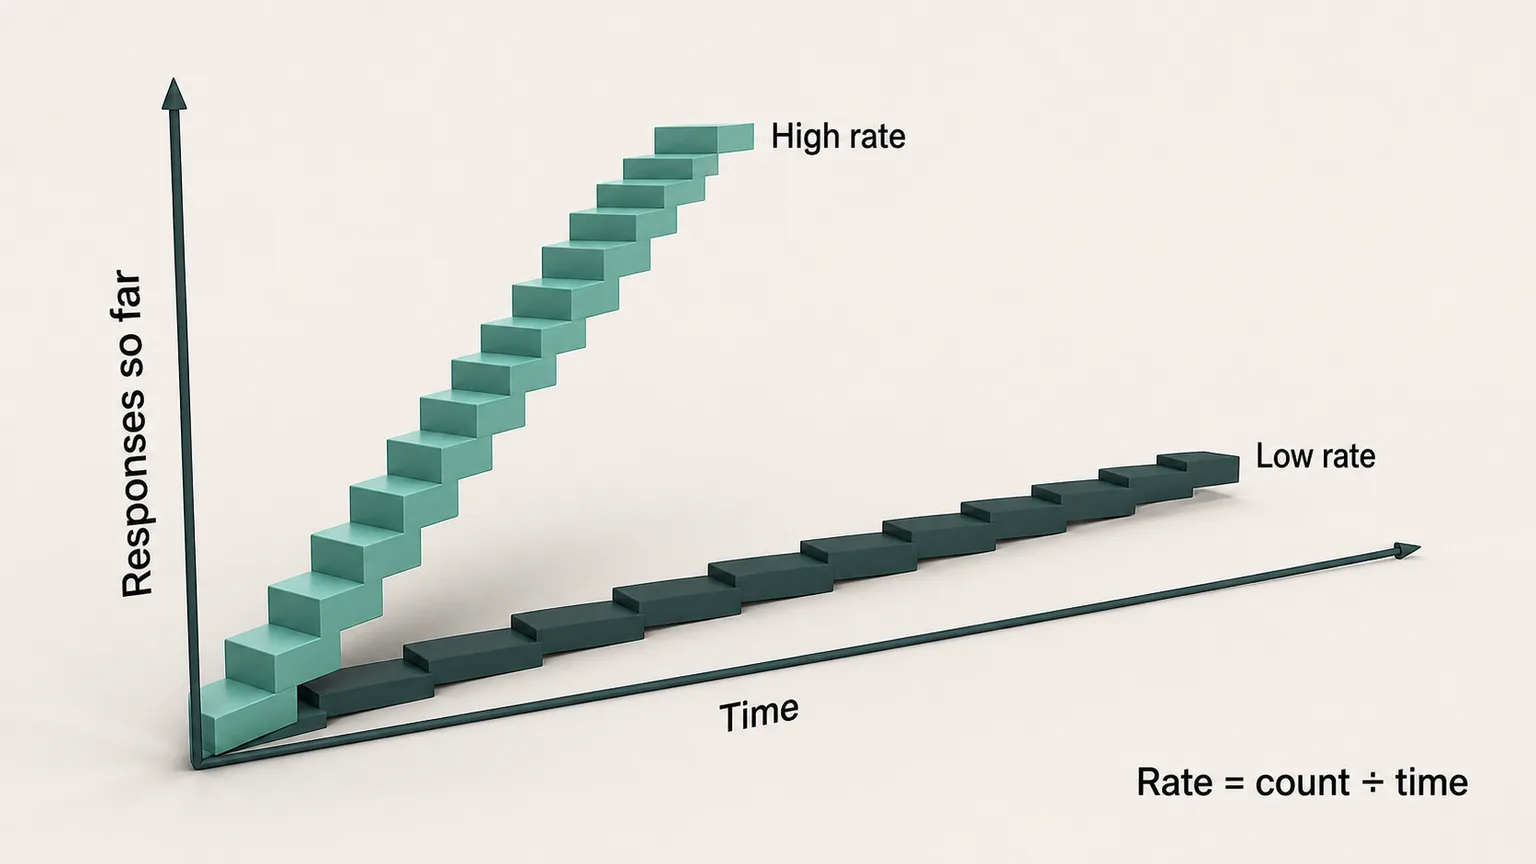
For behavior that the child emits freely — requests, vocalizations, a target sound — counting occurrences is the measure, and dividing by observation time turns a count into a rate you can compare across days. Two disciplines keep it trustworthy: record the observation window (a count without its window is uninterpretable), and treat window length as a judgment about confidence, not a hard cutoff — thirty seconds still computes a normalized rate, but it is one with wide uncertainty and little claim to represent a typical minute.
Frequency vs rate in ABA
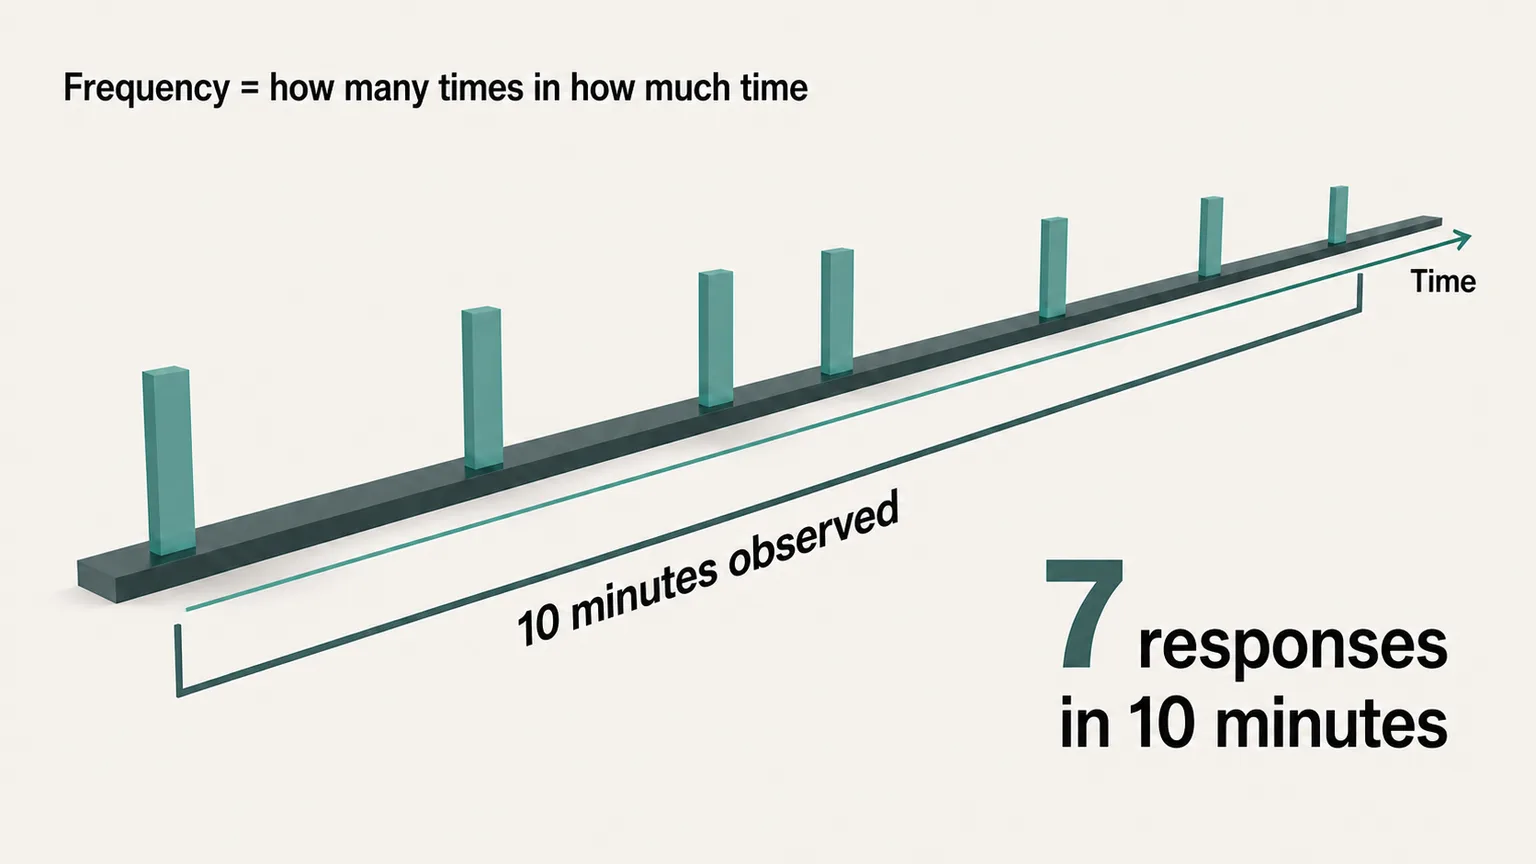
Frequency is the raw count; rate is that count divided by observation time. Seven requests is a frequency. Seven requests in ten minutes is a rate of 0.7 per minute. Frequency can be compared directly only when the observation windows are the same length; rate is the safer comparison when they differ. Neither is appropriate when responses cannot be counted as distinct occurrences or when the behavior mainly matters because of how long it lasts.
How to calculate rate
Rate = count ÷ observation time. Take two days with different windows: on Monday a child makes 12 requests in 20 minutes, which is 12 ÷ 20 = 0.6 requests per minute; on Tuesday, 7 requests in 10 minutes, which is 0.7 per minute. Tuesday has the smaller count and the higher rate. Fix the unit (per minute, per hour) before comparing days, and write the window next to every count.
Duration
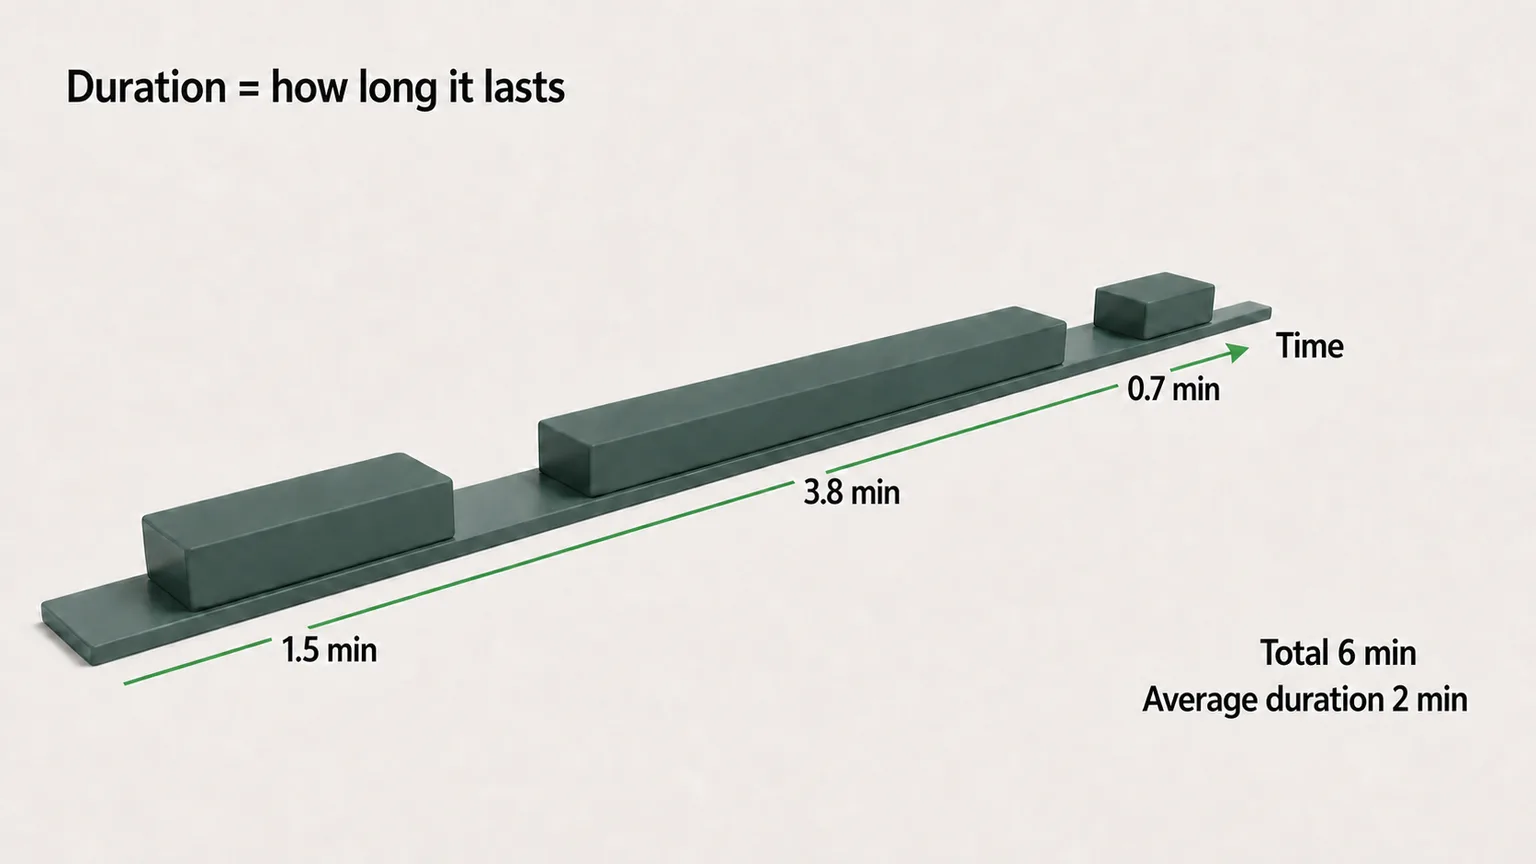
For behavior that lasts — engagement, tantrums, time on task — count and rate miss the point; the clock is the measure. The literature separates total duration from duration per occurrence, and both matter: one twenty-minute episode and twenty one-minute episodes have the same total and call for different programs. Decide in advance what happens to an episode still open when the session ends — closing it at the boundary, rather than discarding it, keeps the record accurate.
Latency recording
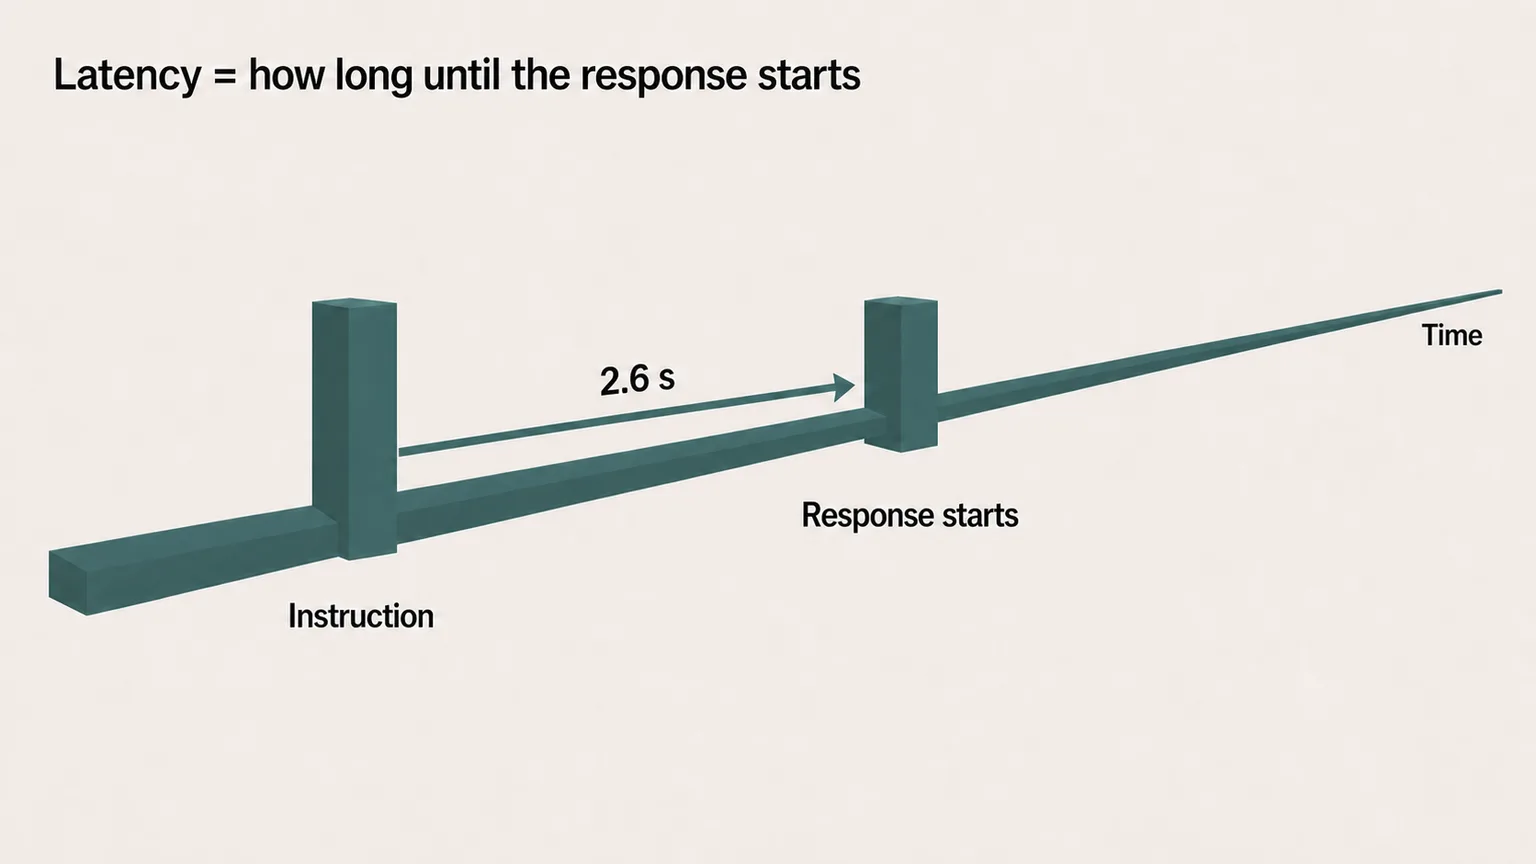
Time from instruction to response. It is the early-warning channel accuracy cannot provide: responding that stays correct while latency stretches often signals that something besides the material is shaping the answer. Latency alone can’t say what that something is — a slow correct response has several possible causes, and identifying the adult (or anything else) as the source needs more than the timer. It also anchors fluency goals: “correct within three seconds” is a different achievement from “correct eventually”.
What is latency recording in ABA?
Latency recording measures the time between a defined cue and the start of the response. Start the timer at the instruction or other antecedent you specified; stop it when the response begins, not when it ends. For example, if an Instructor says “touch red” and the learner begins reaching 2.6 seconds later, the recorded latency is 2.6 seconds. Define both events before observing so two people would start and stop the clock at the same moments.
To summarize several trials, record each latency and average them. If four “touch red” trials give 2.6, 1.8, 3.1 and 1.5 seconds, the mean latency is (2.6 + 1.8 + 3.1 + 1.5) ÷ 4 = 2.25 seconds. A mean that climbs across sessions while accuracy holds is the early warning described above.
Permanent product
Sometimes the behavior leaves an artifact — a completed puzzle, a written word — and the artifact can be scored after the fact, often well after the session ended. It can be the cheapest method going, since nobody has to watch the behavior happen — but only where the product genuinely proves the behavior, and only it: a tidy room does not prove who tidied it, and a correct worksheet does not say how much help the child had along the way.
PLA-check (planned activity check)
Planned Activity Check (PLA-check, also written PLACHECK) is a group interval-recording method. At predetermined moments, the observer scans the group and records how many people are engaged in the defined activity. Divide the engaged count by the number present to obtain the group percentage for that check, then summarize across checks. PLACHECK is efficient for questions such as “what proportion of the class is on task?”, but it does not produce a continuous record for any one learner and can miss behavior that happens between checks. For example, in a class of 10 with five planned checks, 6, 7, 5, 8 and 9 children are engaged: that is 60%, 70%, 50%, 80% and 90% of the group, and an average of 70% engaged across the five checks.
The two checks behind every method
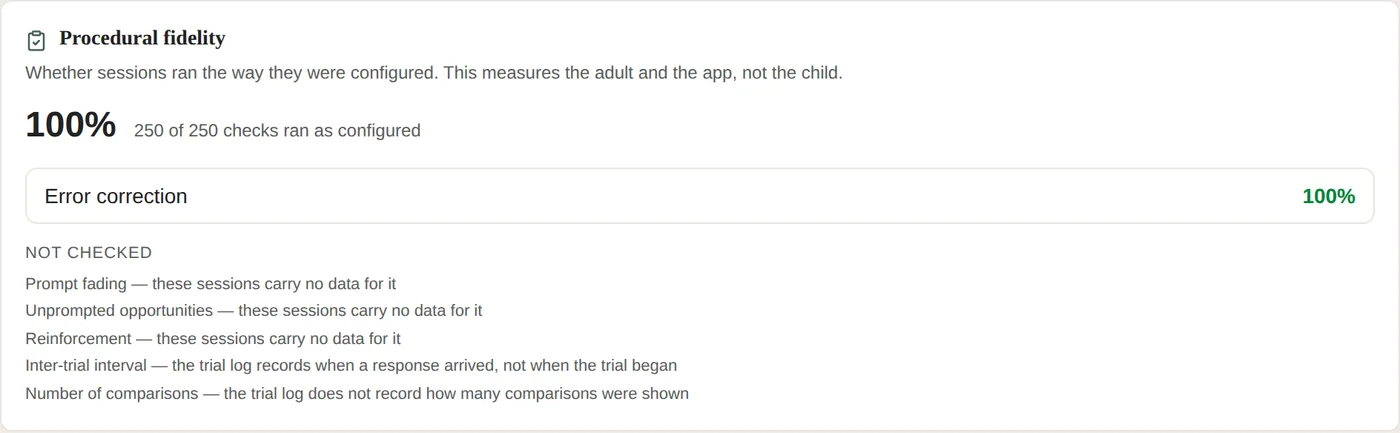
Whatever the method, two questions matter for whether its numbers can be trusted — and neither one, on its own, guarantees the numbers are actually right. Would a second observer, scoring independently, have produced the same record? That is interobserver agreement (IOA), and it is measured, not assumed. And did the session actually run as the program prescribes? That is procedural fidelity. High agreement only says two observers are being consistent with each other — consistently applying the same wrong criterion still agrees; it takes a correct criterion, watched for separately, to call the record accurate. A beautiful graph fails both silently; nothing in the plot tells you the record behind it was reproducible or accurate. We wrote a full piece on both — see below.
What Interlaza records, and what it deliberately leaves to you
Because the app presents the trials, it records what happens in them as a side effect of running the session: every response with its prompt level and latency, trial by trial, with no clipboard involved. Its free-operant modes record counts over a measured window (refusing to report a rate under a minimum of observation), and its duration mode reports total and per-occurrence separately, closing still-open episodes at the boundary. For behavior that has no on-screen trial at all — off-tablet or child-initiated — Record mode lets the Instructor log it directly as it happens, on the same engine, so it still comes with a prompt level and a timestamp rather than a note added after the fact. For a second observer, it can stream a session live so the observer scores independently, without seeing the primary record first, and computes the agreement.
The Instructors page shows how the app records each trial and which checks it reports. What it does not do is decide what to measure. That choice, the pairing of behavior and measure this article is about, stays with the Instructor, where it belongs.
Further reading
- Ledford, J. R., & Gast, D. L. (2018). Single Case Research Methodology (3rd ed.). Routledge — chapters 5–8 on measurement and dependent variables.
- Cooper, J. O., Heron, T. E., & Heward, W. L. (2020). Applied Behavior Analysis (3rd ed.). Pearson.