See every trial. Trust every decision.
Six clinical-grade visualizations turn raw trial data into the insight every instructor, supervisor, and family needs. Real-time, bilingual, and exportable.
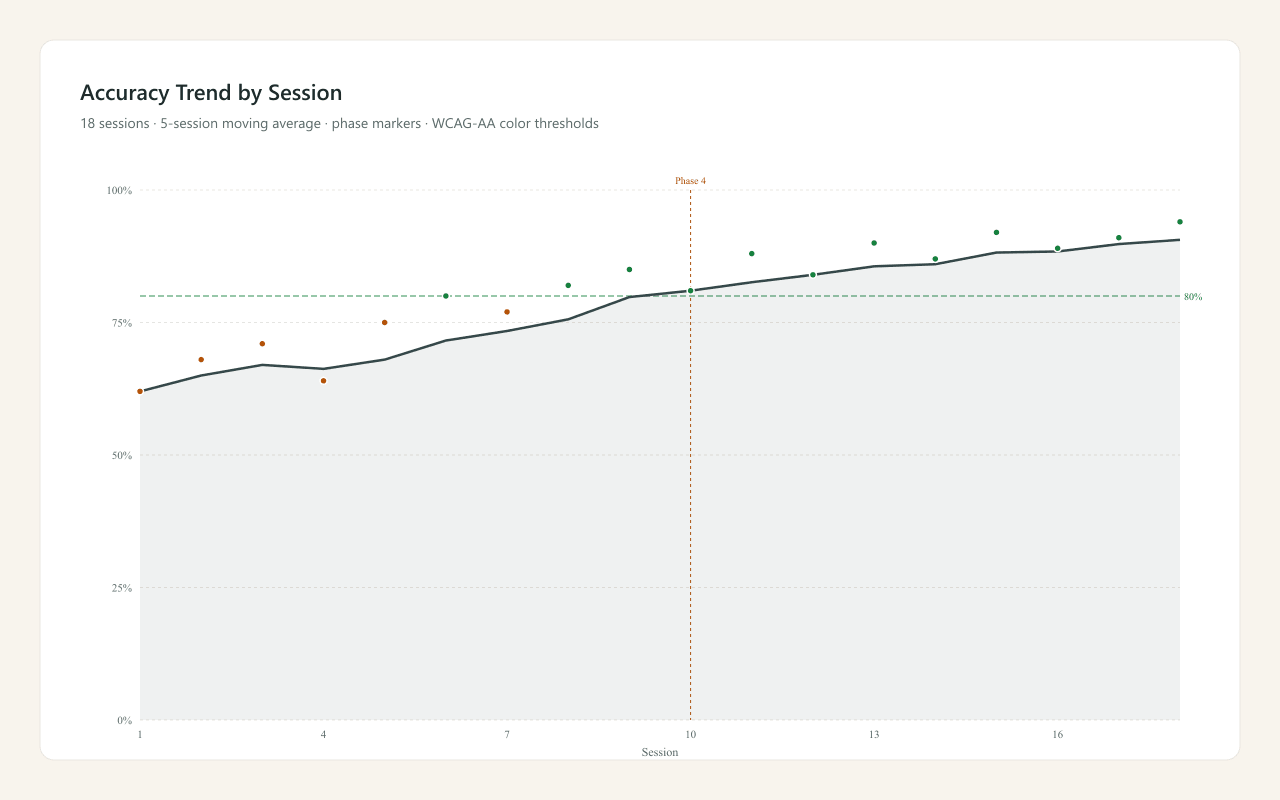
Accuracy Trend by Session
Per-session accuracy with a 5-session moving average overlay. Threshold-colored dots and an 80% mastery reference line so you spot trends in a glance. Phase-change vertical lines mark errorless transitions.
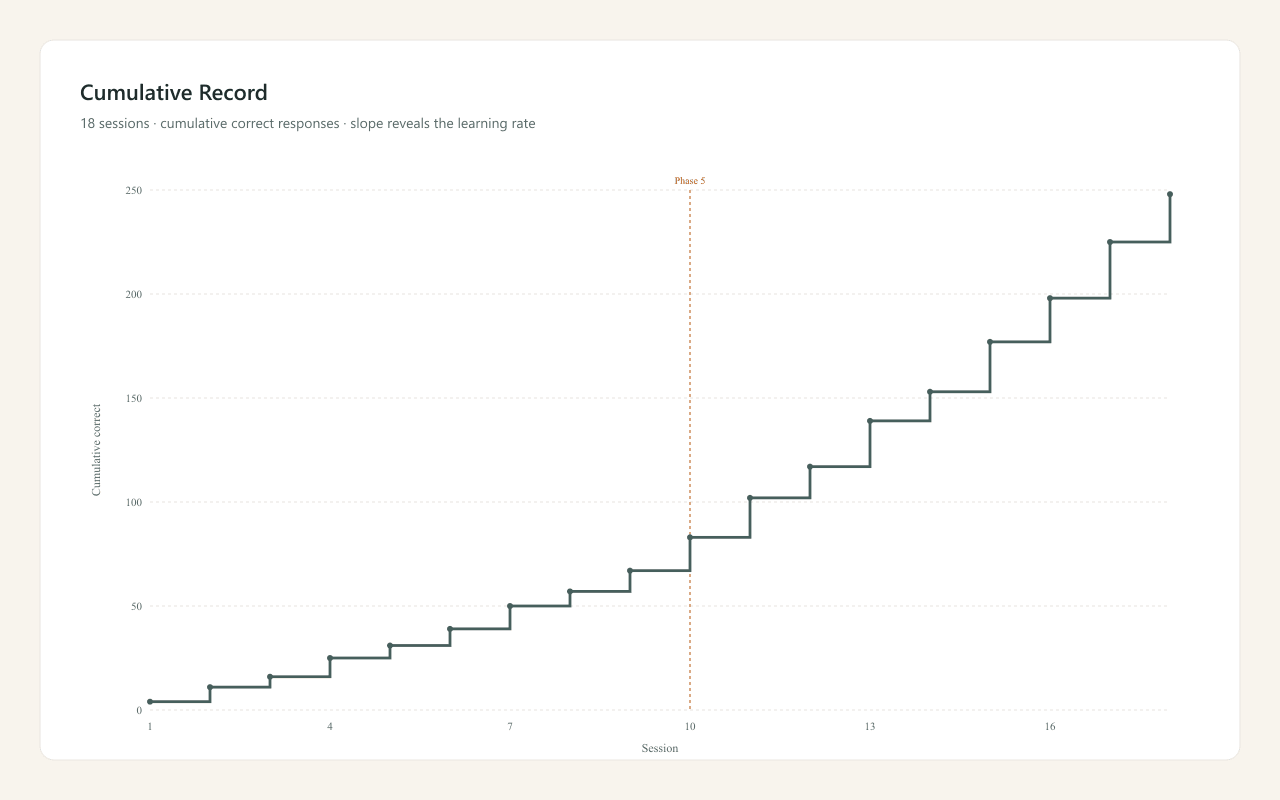
Cumulative Record
The cumulative graph every instructor learns to read. Total correct responses over time — slope reveals the learning rate, flat segments expose stalled progress. The chart your supervisor expects to see.
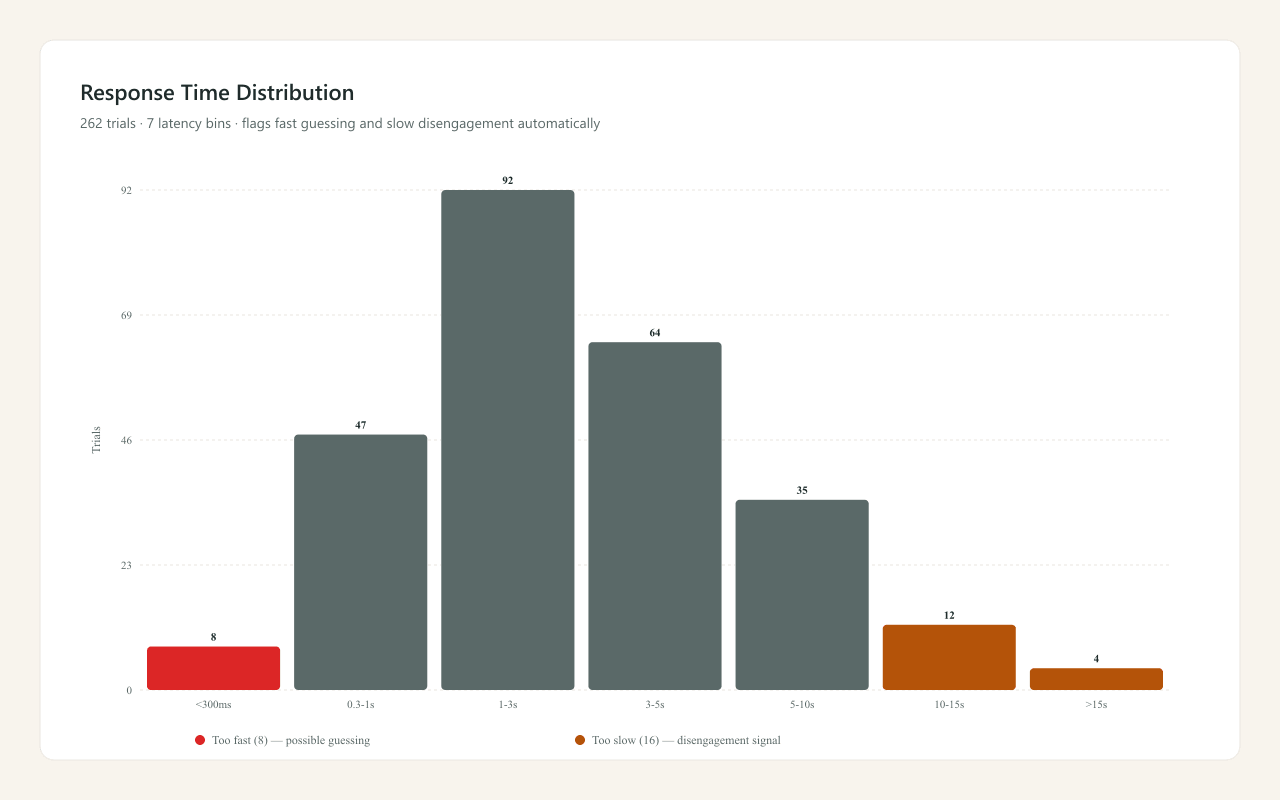
Response Time Distribution
Seven latency bins from <300ms guesses to >15s disengagement. The engine flags fast-guessing and slow-disengagement automatically and adjusts errorless phases — most competitors don't track timing at all.
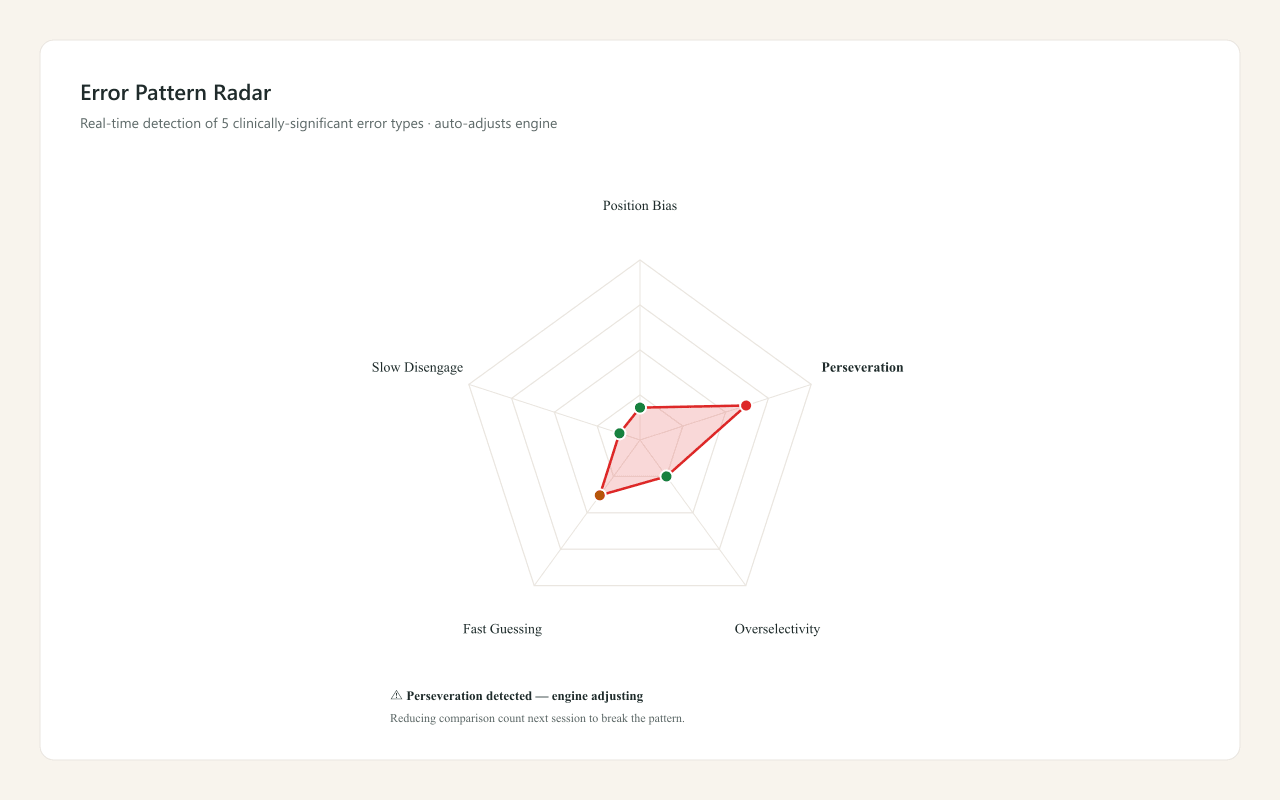
Error Pattern Radar
Real-time detection of five clinically-significant error patterns: position bias, perseveration, overselectivity, fast guessing, slow disengagement. When a pattern crosses threshold, the engine adjusts the next session. Unique to Interlaza.
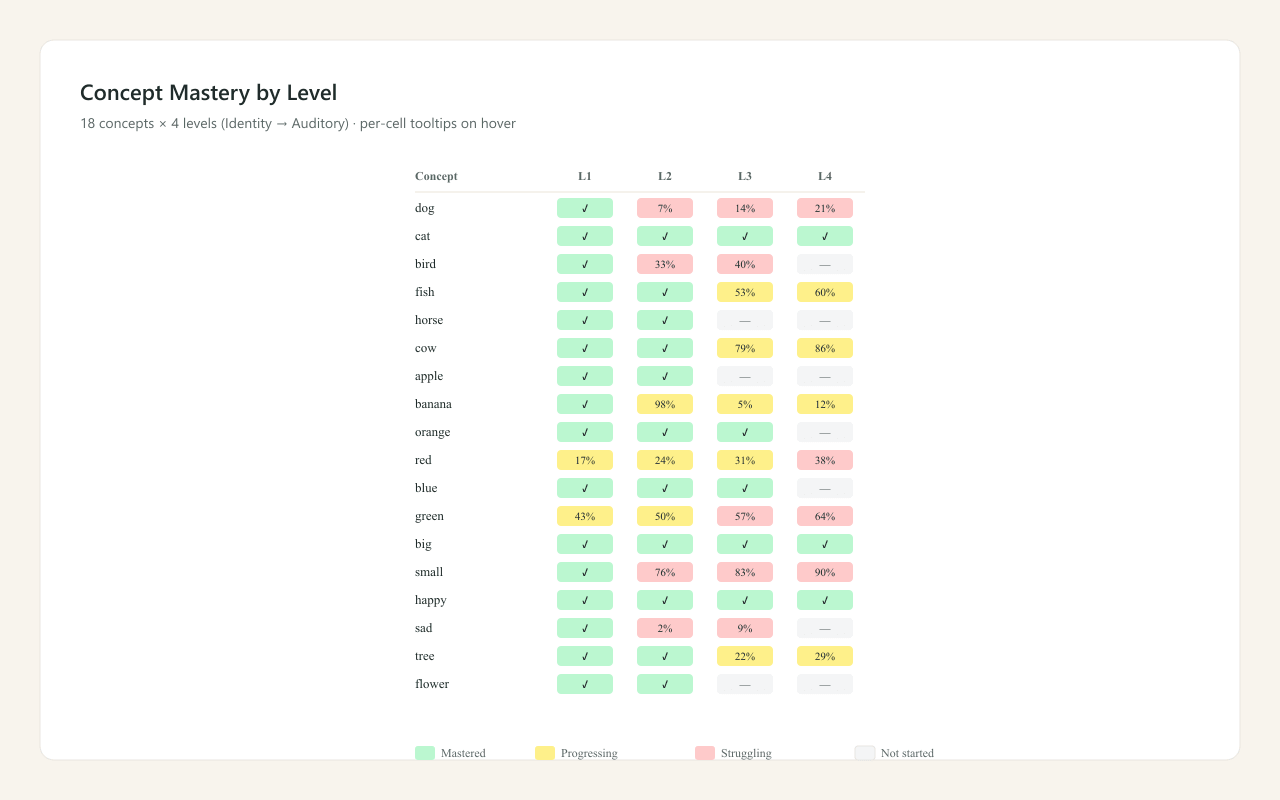
Concept Mastery Grid
A heatmap of every concept across every level — Identity, Non-Identical, Symbolic, Auditory. Hover any cell for accuracy, trial count, and status. The fastest way to spot a stalled concept across a learner's entire library.
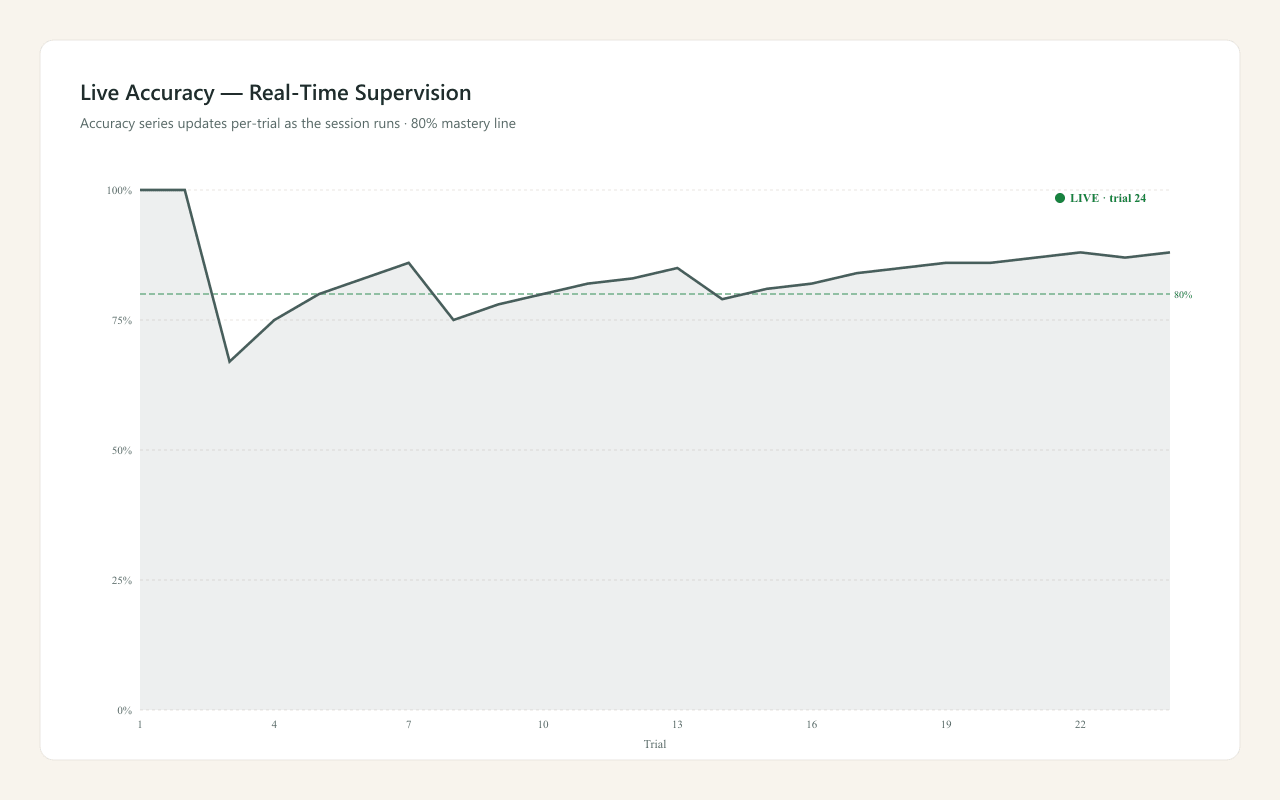
Live Accuracy — Real-Time Supervision
During a supervised session, accuracy updates trial by trial. The supervisor sees fatigue, drift, and breakthroughs as they happen — not after the session ends. Built on Supabase Realtime, ~3 second latency.
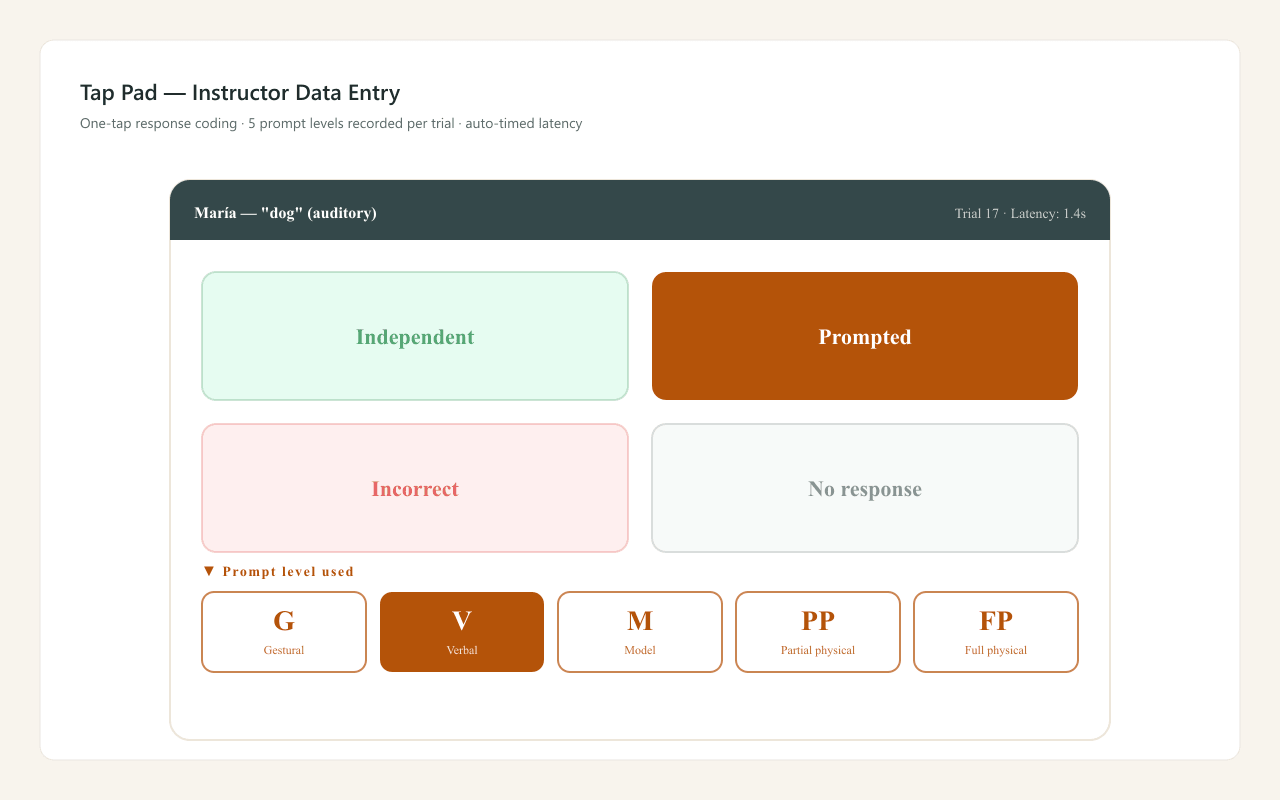
Tap Pad — Instructor Data Entry
For sessions run by an instructor on a tablet, Tap Pad captures every trial in one tap: independent, prompted, incorrect, or no-response. Latency is recorded automatically. The instructor never has to look away from the learner.
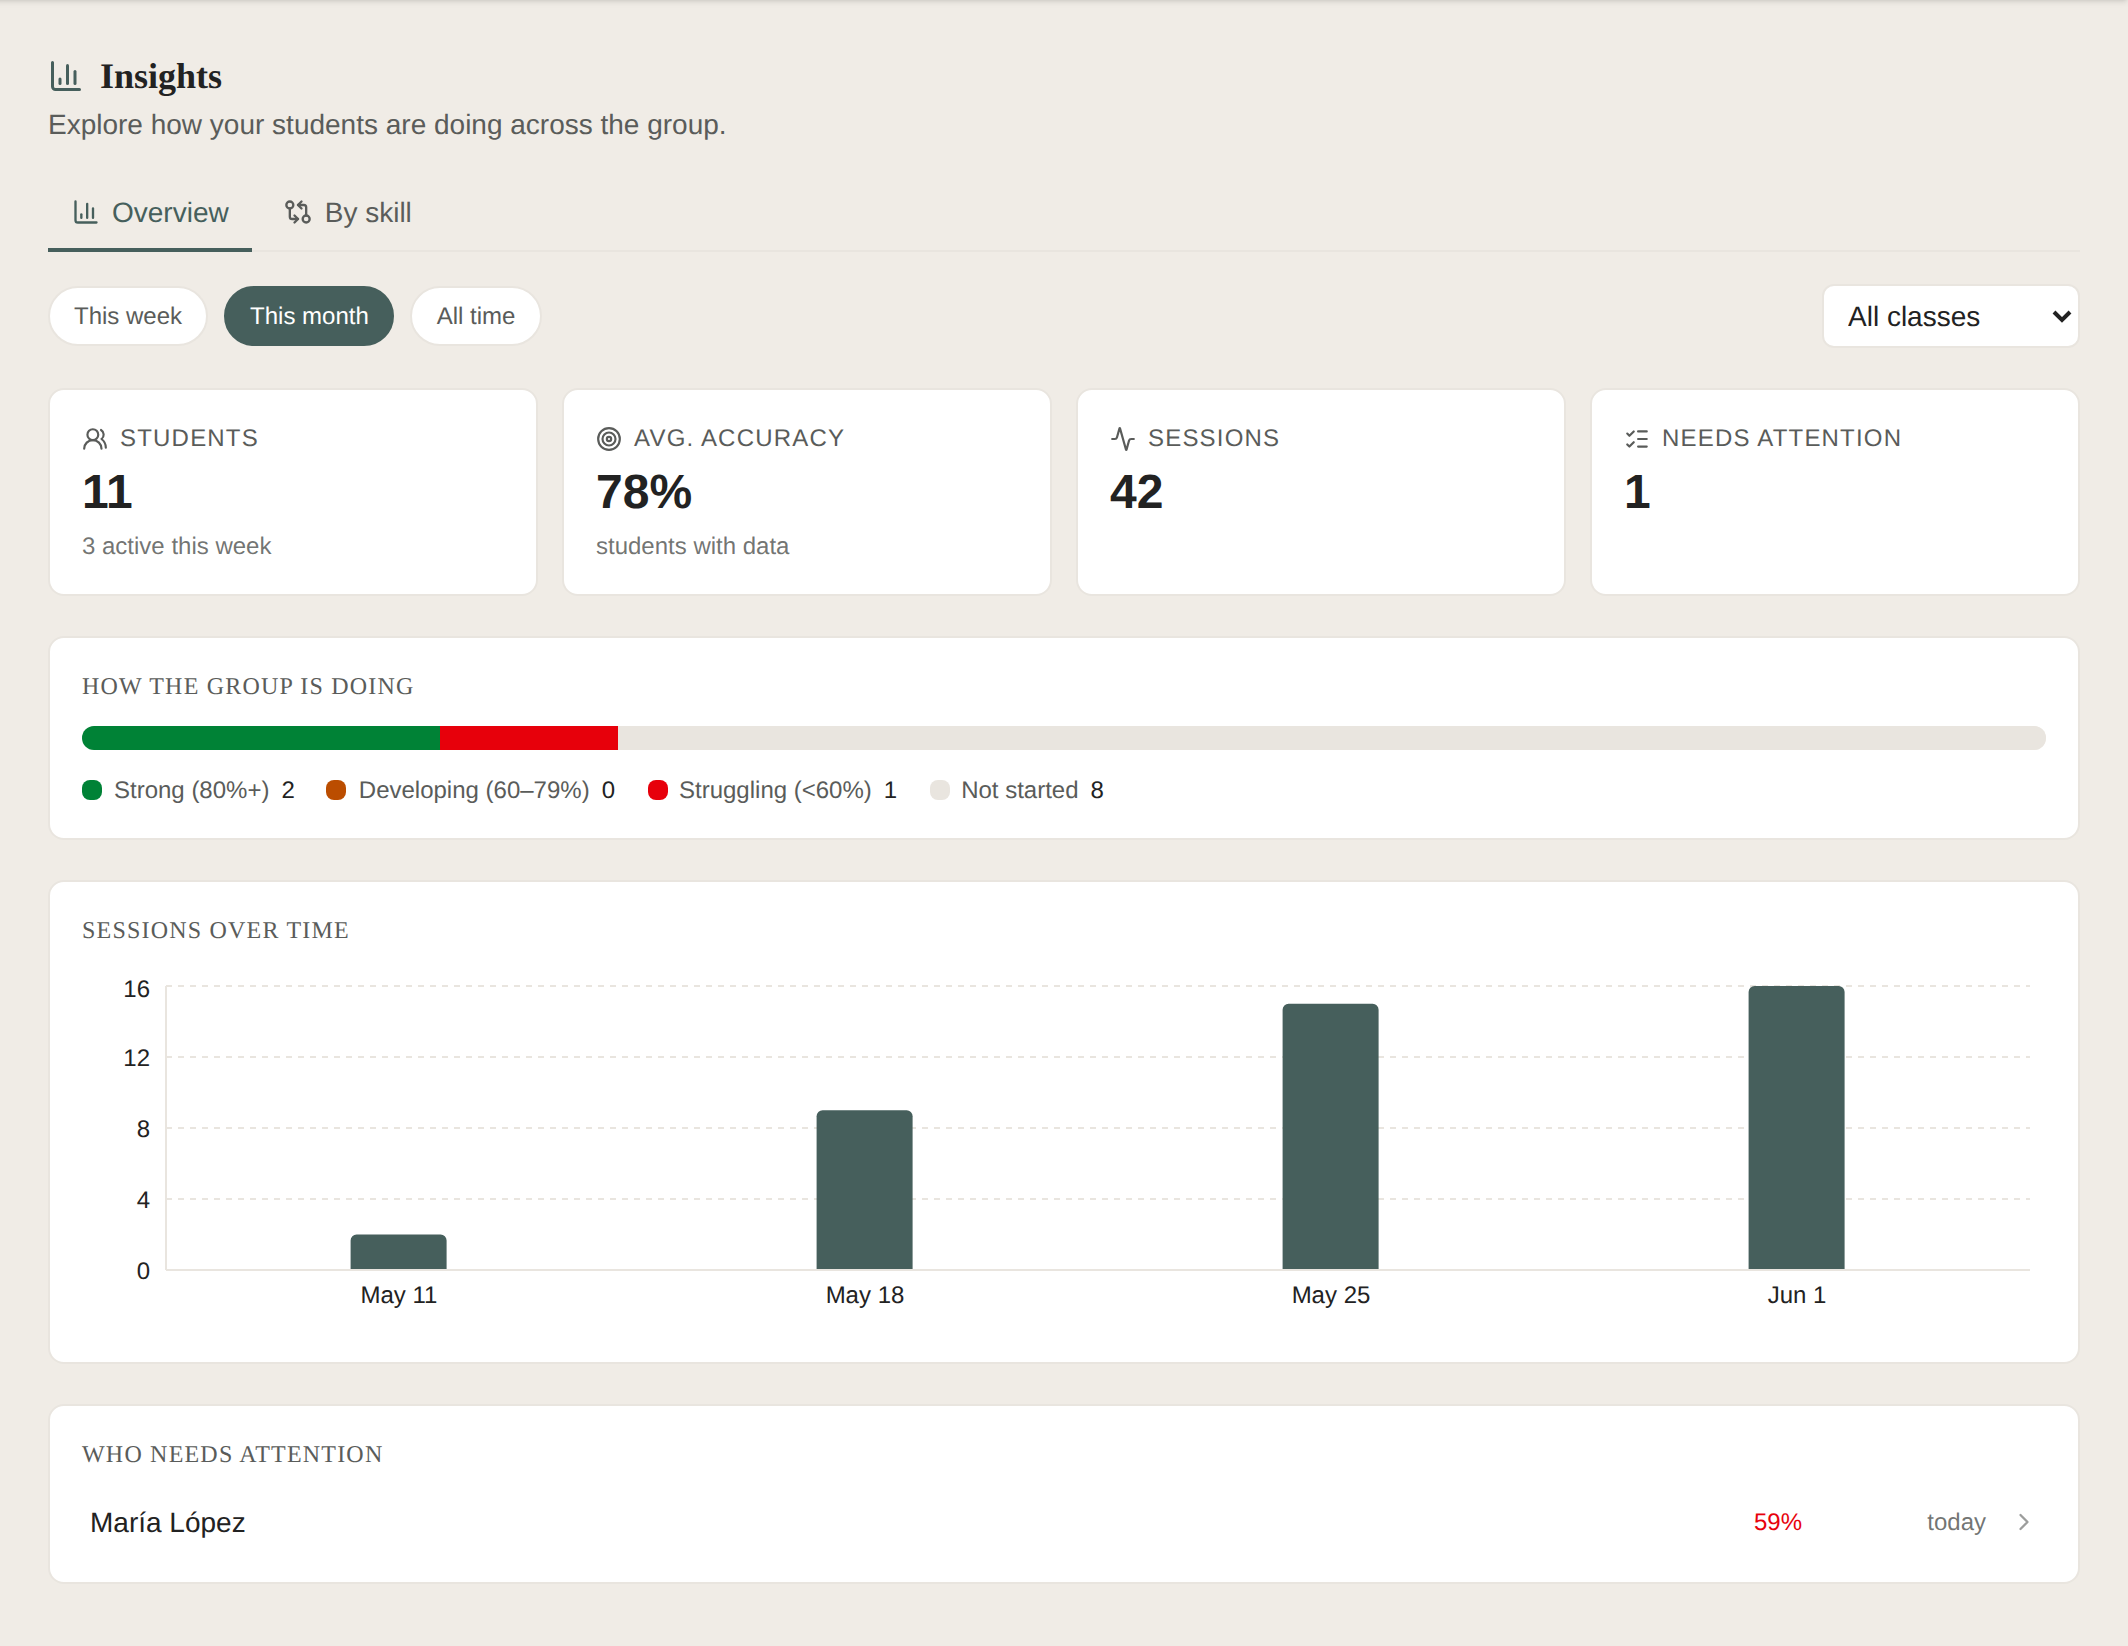
Group Insights — The Whole Caseload at a Glance
One dashboard for every learner you support. See average accuracy, how the group splits across mastery bands, sessions over time, and exactly who needs attention right now — filtered by class and time range. Built for instructors managing 25 to 100 students.
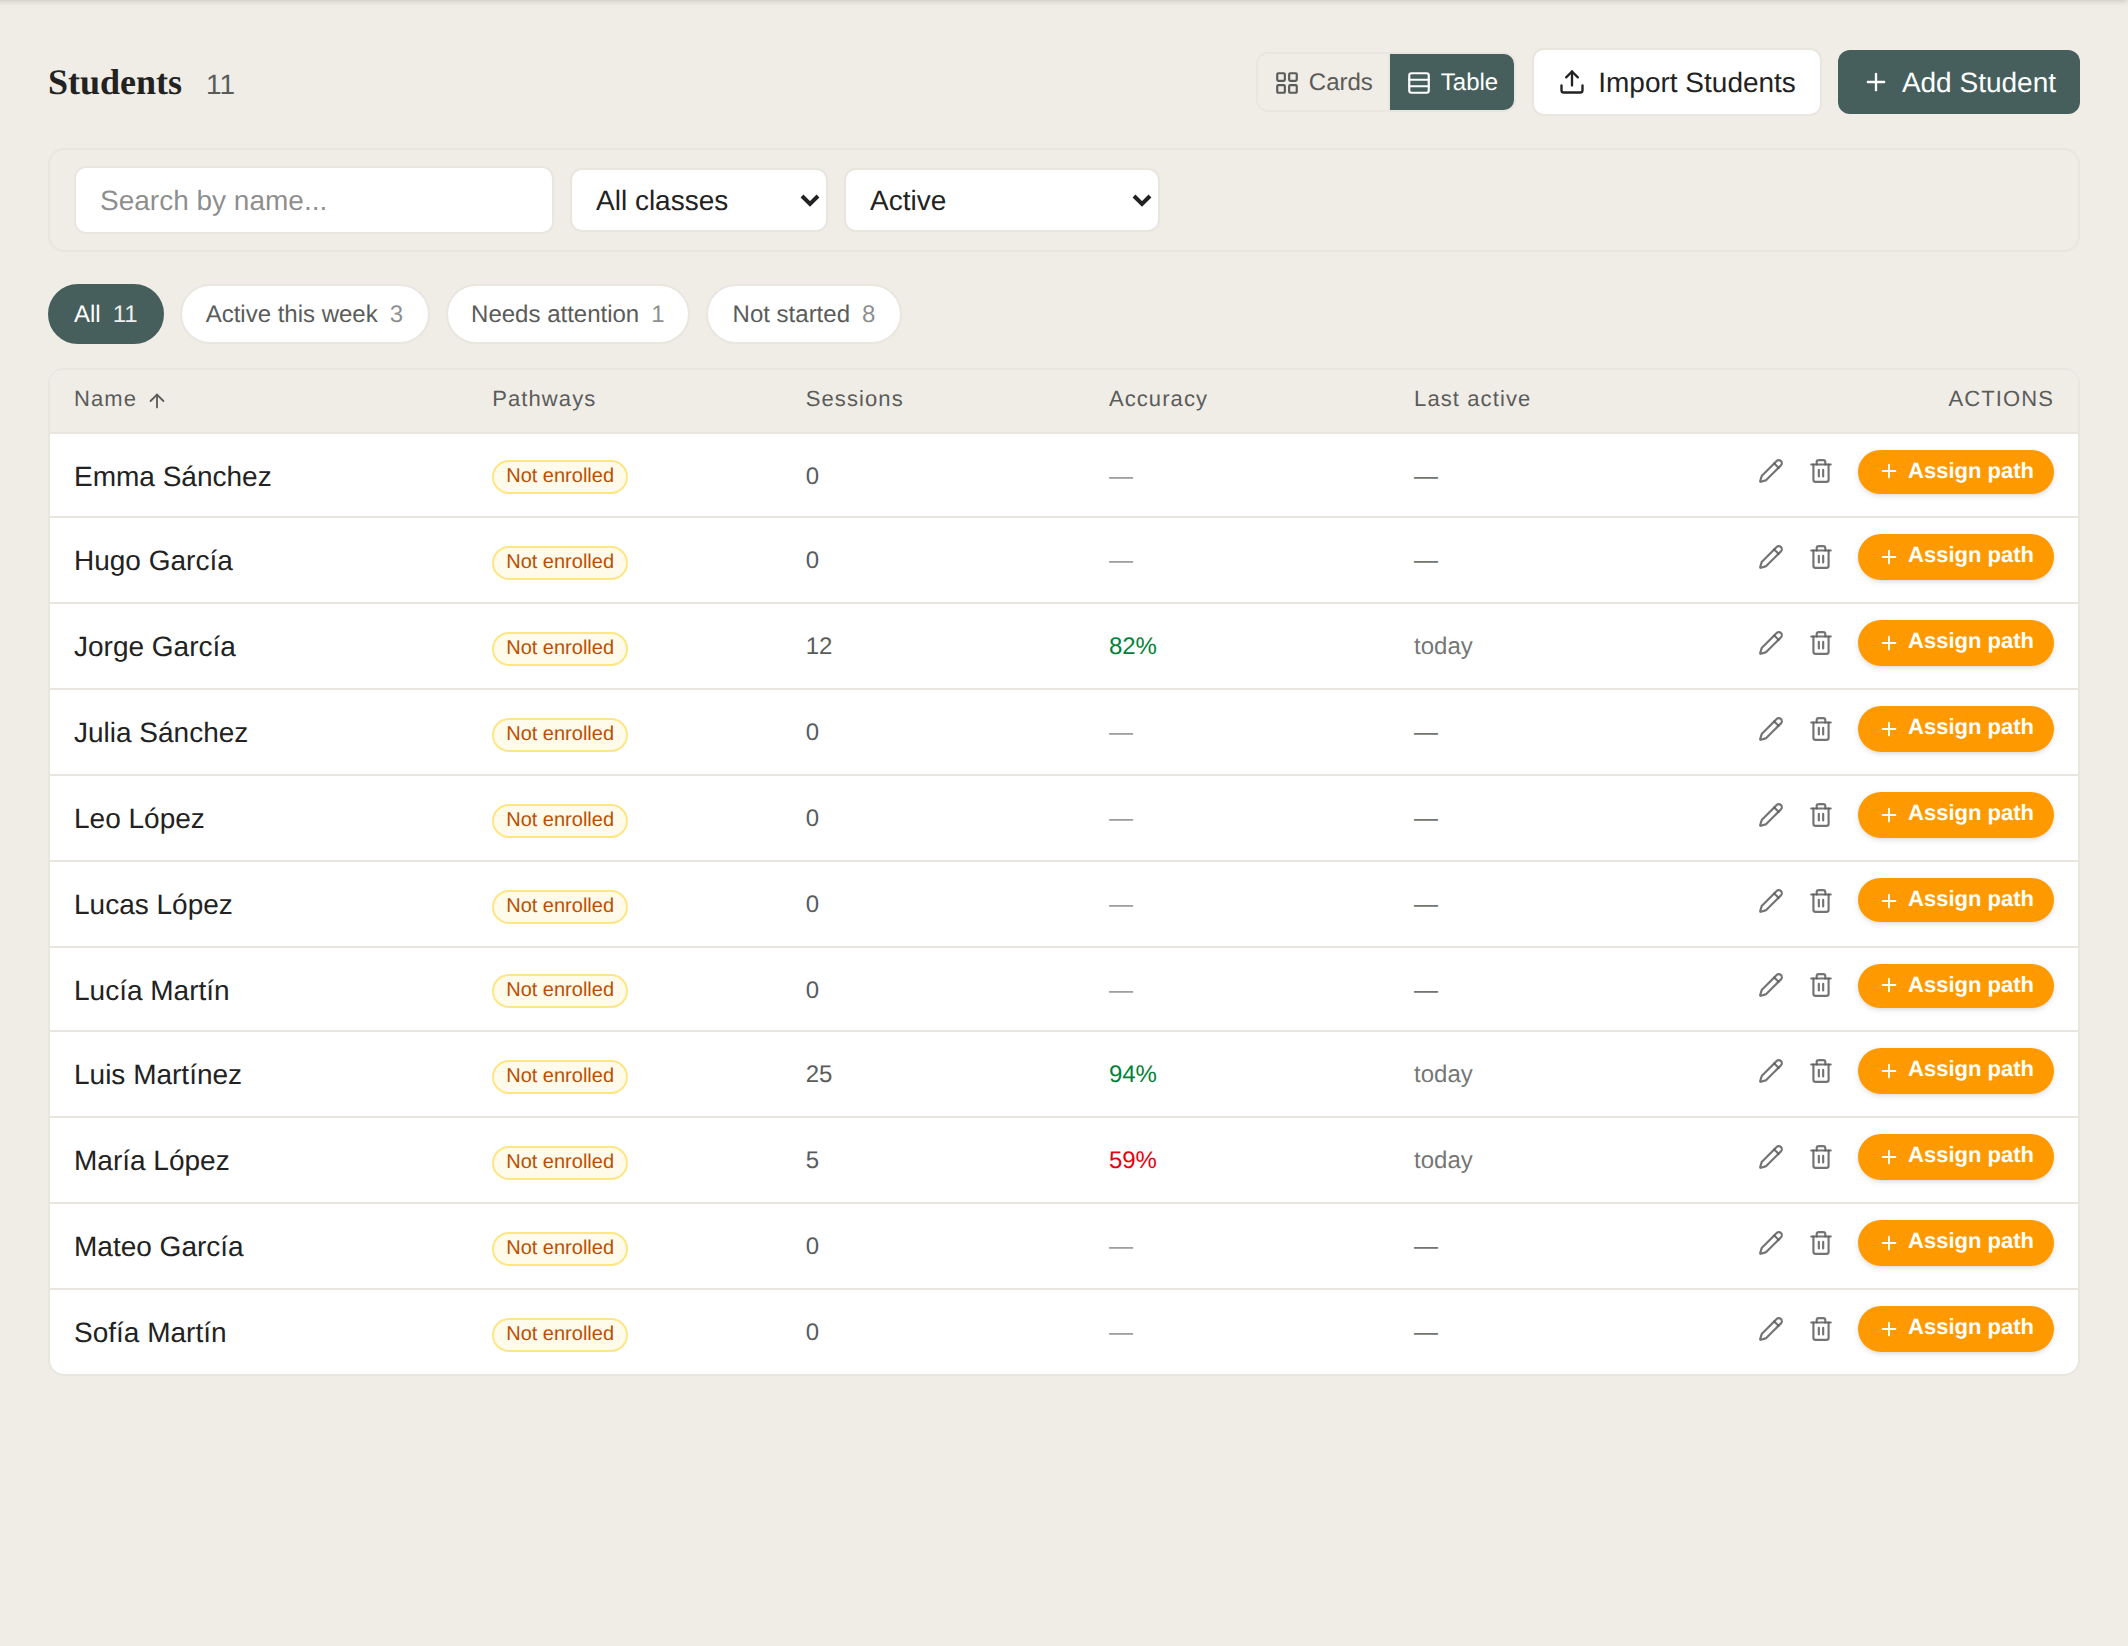
Roster Control Center — Triage at Scale
A scannable roster with the signals that matter: sessions, accuracy (colour-coded), and last-active, all sortable. One-click views — Active this week, Needs attention, Not started — surface the learners who need you, without scrolling through cards.
What sets Interlaza apart
Response-time analytics
Most competitors don't track latency at all. Interlaza bins it 7 ways and flags both extremes.
Real-time error pattern detection
Five clinically-validated patterns surfaced as a radar chart, with the engine auto-adjusting downstream.
BKT-driven adaptive difficulty
Bayesian Knowledge Tracing surfaces P(mastery) per concept and adjusts trial composition automatically.
Live supervision per-trial
Supervisors can watch a remote session update trial-by-trial via Supabase Realtime — ~3s latency.
Tamper-evident trial data
Every trial log is sealed with a SHA-256 hash chained to the previous one. Editing any past trial breaks the chain — verifiable by anyone, not just us. The data you publish, defend, or bill against is provably untouched.
Get your data working for you
Every chart you see here exports to PDF for parent reports and to CSV for research analysis. Bilingual EN/ES out of the box.
Start free